Mapping and Scaling data values
Squey is all about visualizing data in Parallel Coordinates views and about speeding-up the investigation and discovery processes by use of:
the central Global Parallel Coordinates View
all the satellite Views
Such an investigation usually starts with a set of data that is parsed and cut in small pieces that end up filling a big table of values. This stage of the process requires a Format, that gives a description of how to cut the data, line by line.
But some more settings are required to turn this table of data into something that can be plotted on vertical Axes: namely, one needs to give two settings per Axis (i.e. column of the data table):
a Mapping: this tells Squey how it should map the values of that Axis (i.e column) to mathematical values (real numbers or integer numbers) that naturally sit on a mathematical Axis.
a Scaling: this setting tells Squey how it should map the preceding mathematical values to the segment of the vertical Axis visible in the Global Parallel Coordinates View.
Let’s take a simple example! Consider IPv4 values. The “IPv4” Mapping transforms the X.Y.Z.T IPv4 adresses into the canonical 32bits integer number it represents. (And nothing more is done at this stage of process). Then, a Scaling with specific settings will transform this 32bits Integer value into a mathematical value that sits in the [0;1] interval (as a range that represents the part of the Axis visible in the Global Parallel Coordinates View).
These two-stage (Mapping, Scaling) settings needed for all the Axes created by the splitting process, are also stored in the Format file. Therefore, a format is what is used by Squey to figure out all it needs to execute:
The Splitting Process
the Mapping Process
the Scaling Process
Mapping
This editor enables changing the current mapping configuration.
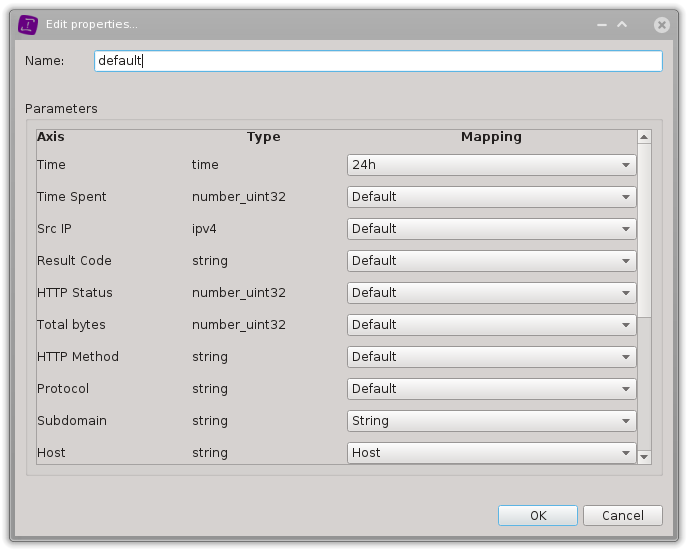
It allows to change, for each axis, the settings initially provided by the format:
its type
its mapping
Scaling
This editor enables changing the current scaling configuration.


It allows to change, for each axis, the settings initially provided by the format:
its scaling