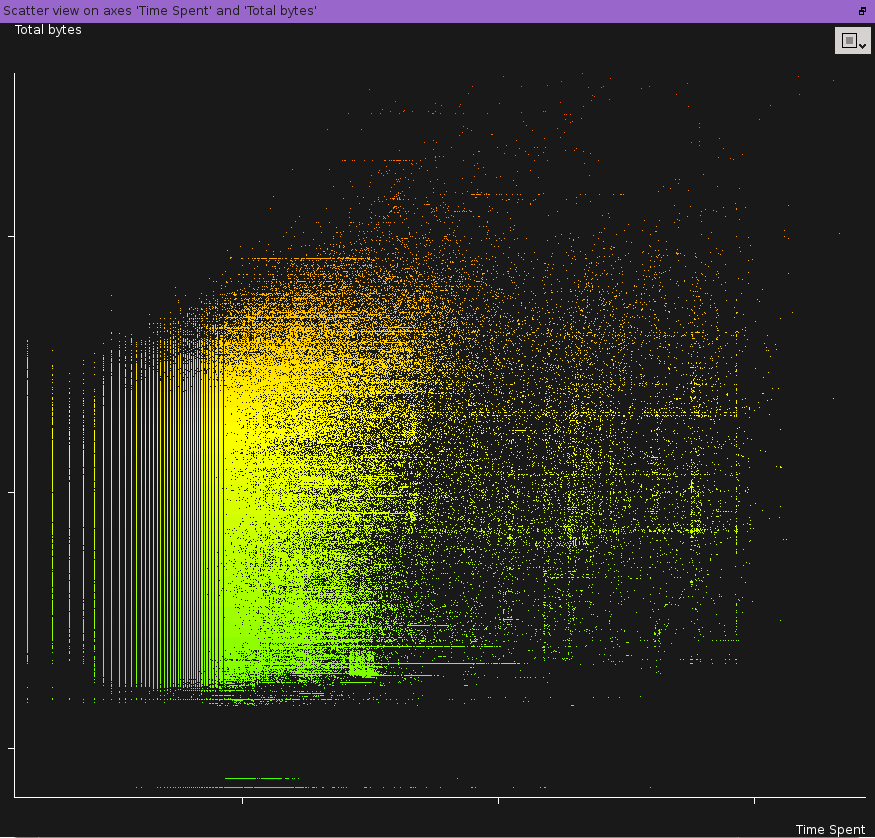
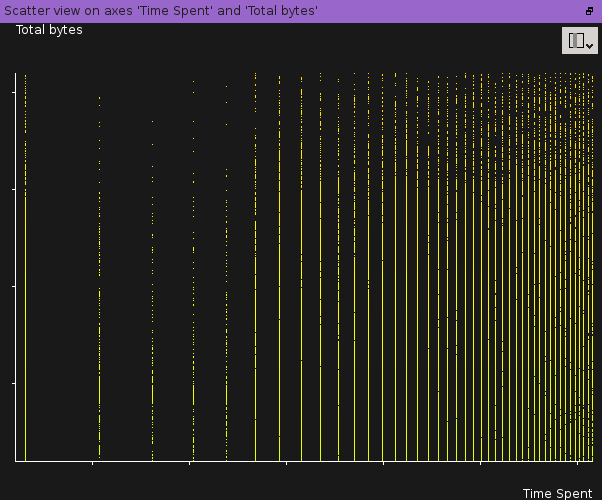
Scatter Plot View
This graphic View provides an alternative zone representation using cartesian coordinates instead of parallel coordinates.
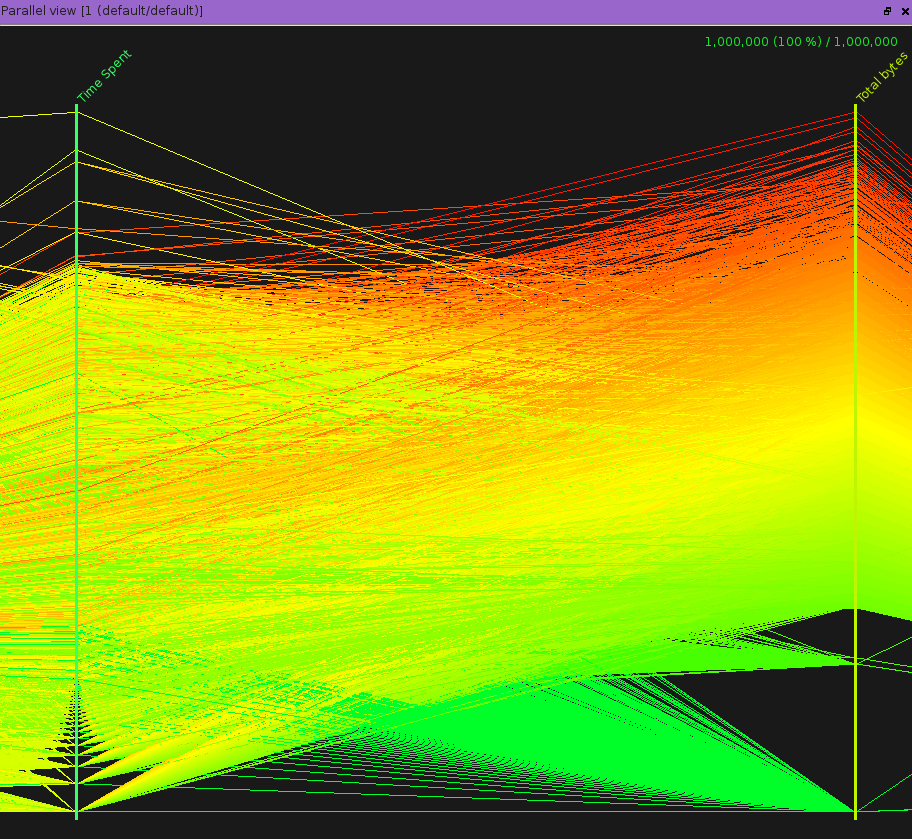
For comparison, here is the same zone represented using parallel coordinates:
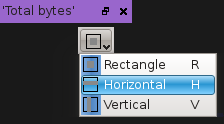
Selection modes
In order to make it easier to select events, three selections modes are avaible. They can be switched from the view toolbar or directly with their keyboard shortcuts.
Zoom
As usual, zoom level can be changed using the mouse scroll button.
Accessing the view
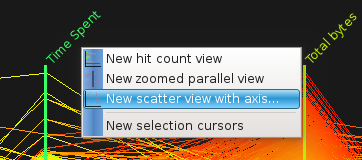
There are three ways to access this graphic view.
By right-clicking on the header of a zone on the parallel view:
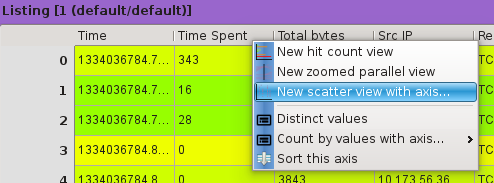
By right-clicking on the header of column in the listing view:
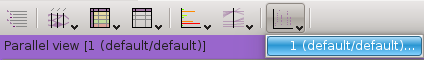
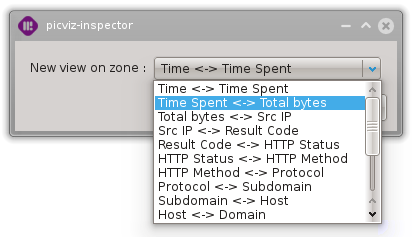
By clicking on the scatter view button located on the workspace toolbar and selection the appropriate zone: