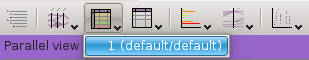
Listing View
The purpose of the Listing View is to present the data in its textual representation. Therefore, it is a tabular representation of the original data with one line of the table dedicated to one Event of the dataset, and one Column of the table dedicated to one Field of the dataset. Each value of a Field in a given Event has a textual representation (i.e. as a string) that is shown as a listing in a given cell of a table.
The Listing View has the following aspect:
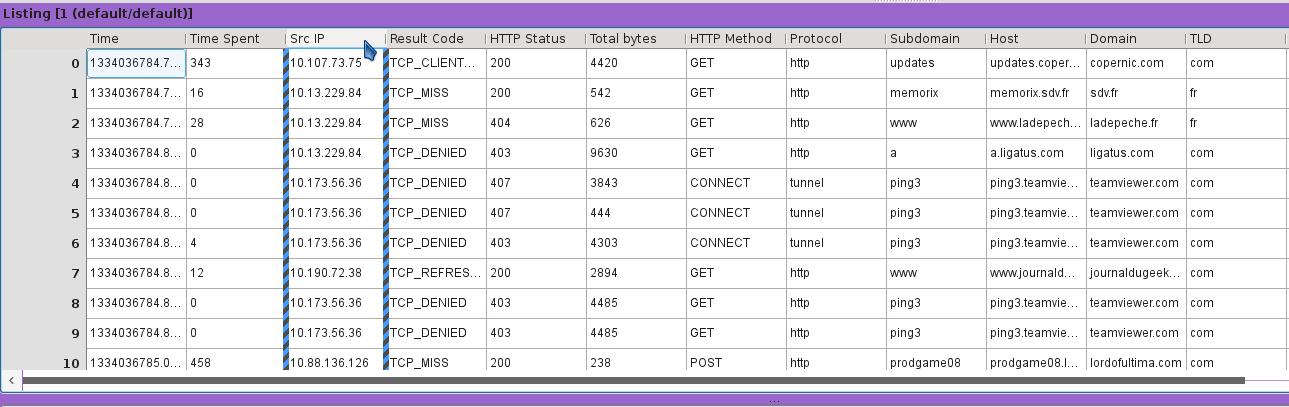
On the left margin, each row (i.e. line) of the table is referenced by a number which is its row index in the imported dataset. In the upper margin, each column inherits a title that has been defined by the user in the Format used at import time for the original data.
The bottom part of the Listing View optionaly shows the Statistics Panel associated to the data. This Statistics Panel will be described in a later section of this document but we can precise right now that its main purpose is, by default, to show the number of distinct values in each column of the listing.
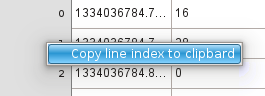
A line index can be copied to the clipboard by doing a right click on the left margin.
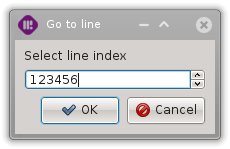
By pressing the ‘g’ key, a dialog allows to go to a given line index. If the line index refers to an unselected Event, the nearest selected one will be used.
Selected, Unselected and Zombie Events
As Squey is all about investigating and diving into large datasets of Events, it often happens that one focuses on subsets of the whole dataset. As the investigation goes on, more subsets are created. During the analysis made through Squey, it is natural for the user to have some subsets active and some other inactive.
In the terminology of Squey, these subsets are associated with Layers. (A Layer is a selection of a subset of Events and, for each of these Events, a color property).
If we consider a specific Event of the global dataset (the imported Source), at a given moment in time, it can be in one of the three mutually exclusive states:
The Event can be selected, meaning that it belongs to one of the active Layers in the Layer Stack View and it also belongs to the current selection.
The Event can be unselected, meaning that it belongs to one of the active Layers in the Layer Stack View but it does not belong to the current selection.
The Event can be zombie, meaning that it does not belong to any of the active Layers in the Layer Stack View.
This distinction between the different status of an Event is fundamental. Every user of Squey should be comfortable with it.
In the Listing View, the distinction is very easy to observe:
Selected Events have bright colors (Saturation and Value is at there maximum).
Unselected Events have shaded colors.
Zombie Events are in black.
By default, Zombie Events are not shown in the Listing View.
Statistics Panel
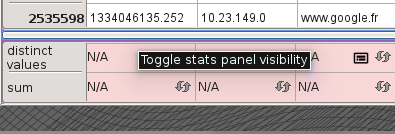
The Statistics Panel located at the bottom of the Listing View provides a convenient way to quickly access informations about Columns, such as ‘distinct values’ or ‘sum’.

Distinct values dialog visibility can be toggled by clicking on the cell icon.
Right-clicking on the vertical header opens up a contextual menu allowing to chose which tools are enabled or disabled (sum, min, max, average).
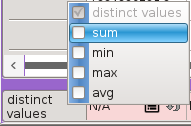
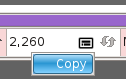
Cell values can be copied to clipboard using the contextual “Copy” menu.
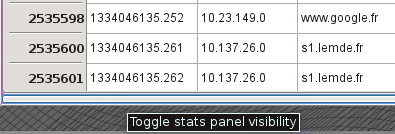
The panel visibility can be toggled by clicking on the “Toggle stats panel visibility” button.
Resizing columns
Resizing Columns to properly fit their content can be done by moving the column header border or using the ‘control’+’mouse wheel’ shortcut.
Note
A cell content that may not fit in the current cell width can nevertheless be fully displayed by leaving the mouse over the cell for a few seconds. The full content pops up as a toolip.
Header context menu
The context menu of the listing’s header allows to create graphical and statistics Views on a given Column as well as sorting the values of the Column.

The context menu of the listing’s header
Cell context menu
The context menu of the listing’s cells allows to:
Apply an Axis Gradient Filter on the axis.
Filter the values of the column: #. ‘Search using this value…’: displays the search dialog filled with the content of the selected cell. #. ‘Search for this value’: filters the column using the content of the selected cell. #. ‘Search for’: displays an empty search dialog.
Copy the content of the selected cell to the clipboard.
Set a color to the selected events.

The context menu of the listing’s cells
Selecting events
Selecting Events from the Listing View means commiting a selection to the current Layer. There are several ways to select Events from the Listing View:
. Select a single event by double-clicking on its line number. . Highlight several events and press Enter. . Use the contextual menu on a cell to filter events using given criterias.
Visual synchronisation with the parallel view
Placing the mouse over a column title highlights its associated axis title and helps keeping track of the association column/axis. + Note that this highlight works in both ways, thus placing the mouse over an axis titles highlights its associated column borders.
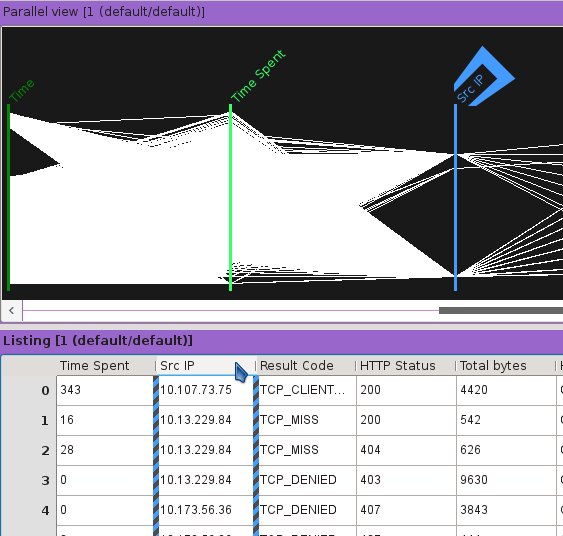
Clicking on a column title translates the parallel view so that the associated axis is being placed on top of it (if the parallel view is located on top of the listing view and are starting at the same horizontal screen coordinate). Clicking on an axis title translates the listing view so the associated column becomes visible.
How to access this View