Hit Count View
This View allows the user to visualize the density of events along a specific axis.
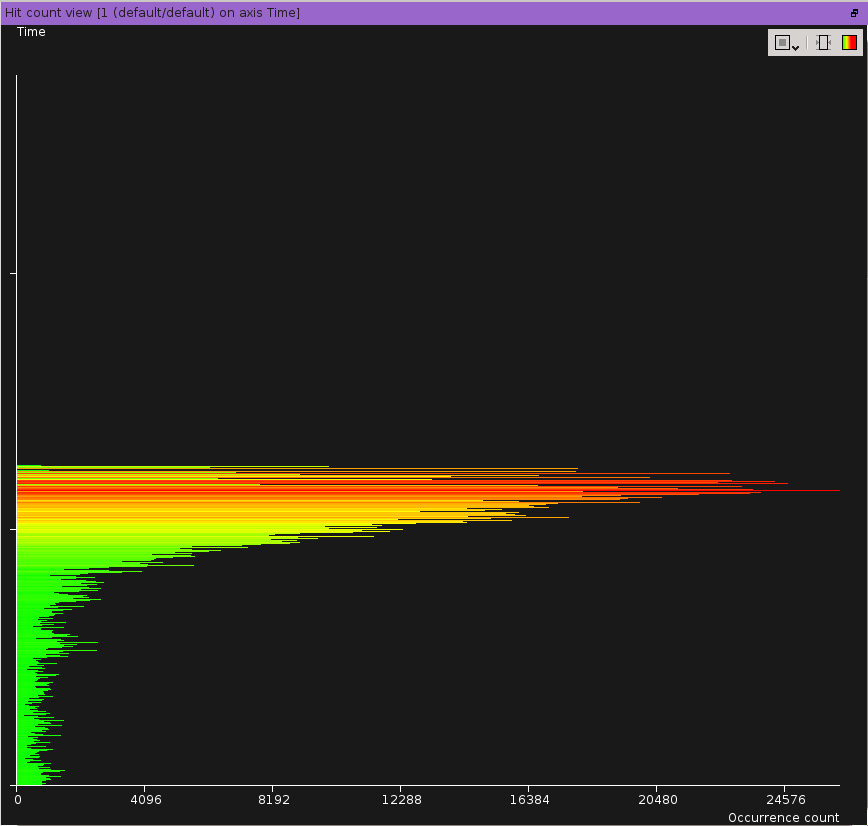
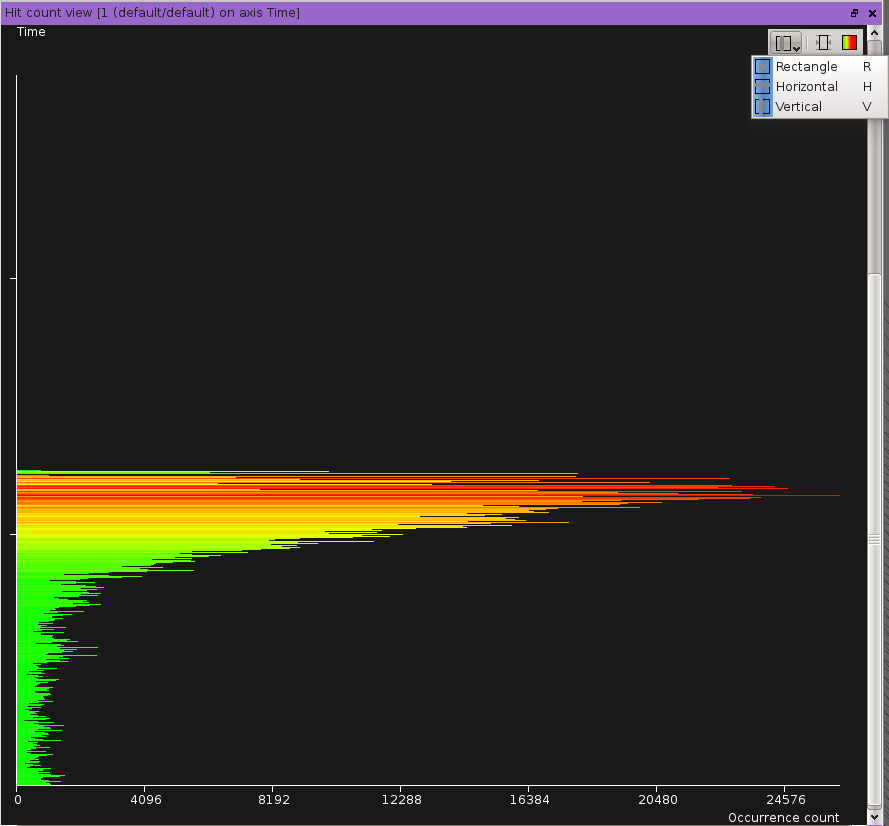
An hit count view
The visualized axis is represented vertically while the density is represented horizontally. The density visibility is accentuated using a color gradient from green (low density) to red (high density). Two gradient modes are available and they can be switched using the l (ell) key:
linear (the default mode)
logarithmic
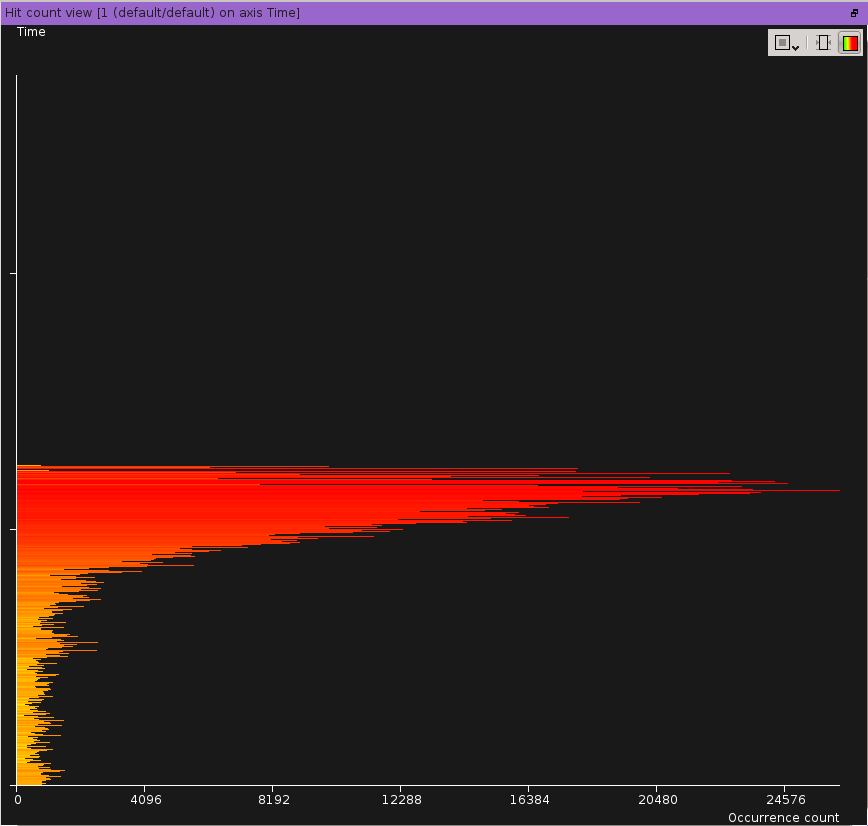
The same hit count view with the logarithmic color gradiant
Selection modes
The selection tool permits to select events for which the hit count fits in the selected area. The selection tool has three different modes. The mode can be set using the tool box in the top-left corner of the view.
Rectangle mode
This mode is the default one. It permits the user to define a free area to control which event range and which hit count range he wants to select.
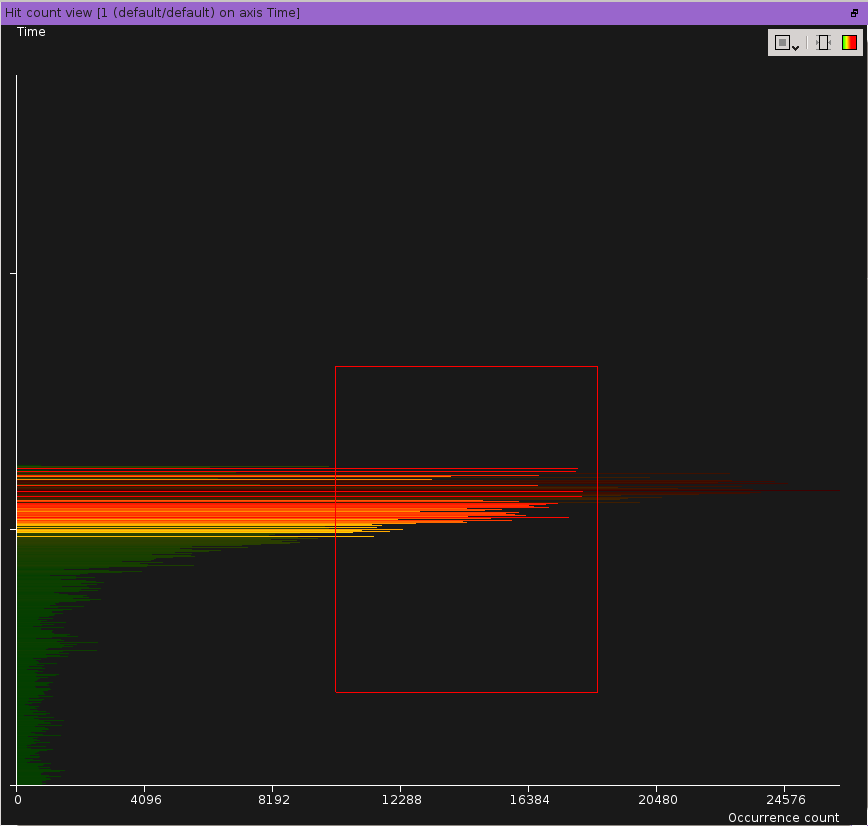
Sample of rectangle selection
Horizontal mode
This mode makes the selection rectangle always fits the whole horizontal value range. It helps selecting events whatever their hit counts.
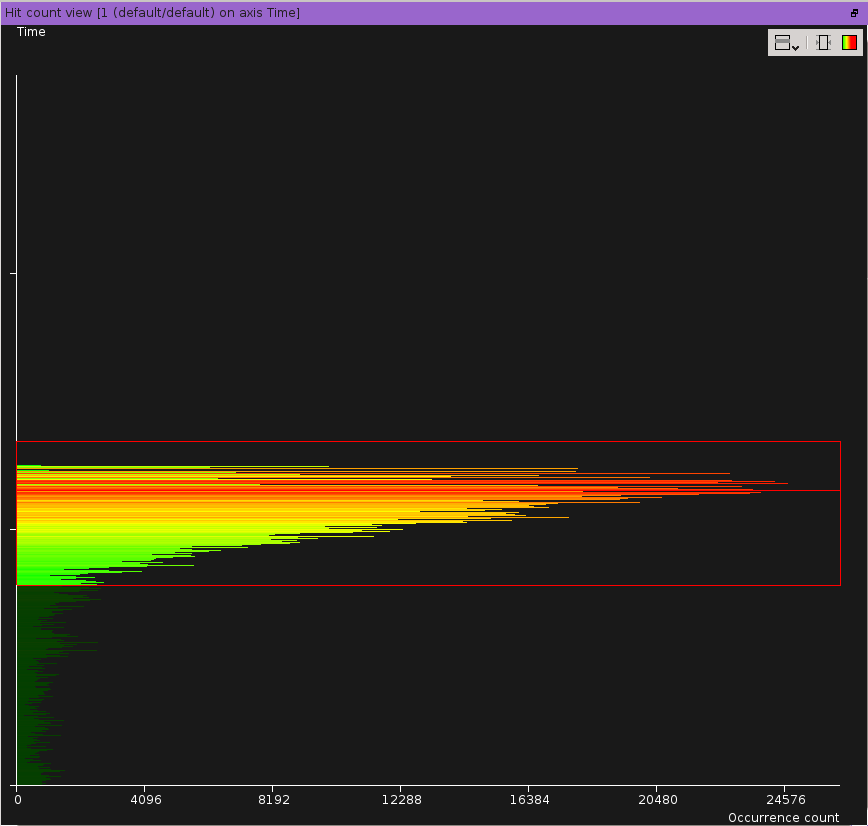
Sample of horizontal selection
Vertical mode
This mode makes the selection rectangle always fits the whole vertical value range. It helps selecting events according to their hit counts.
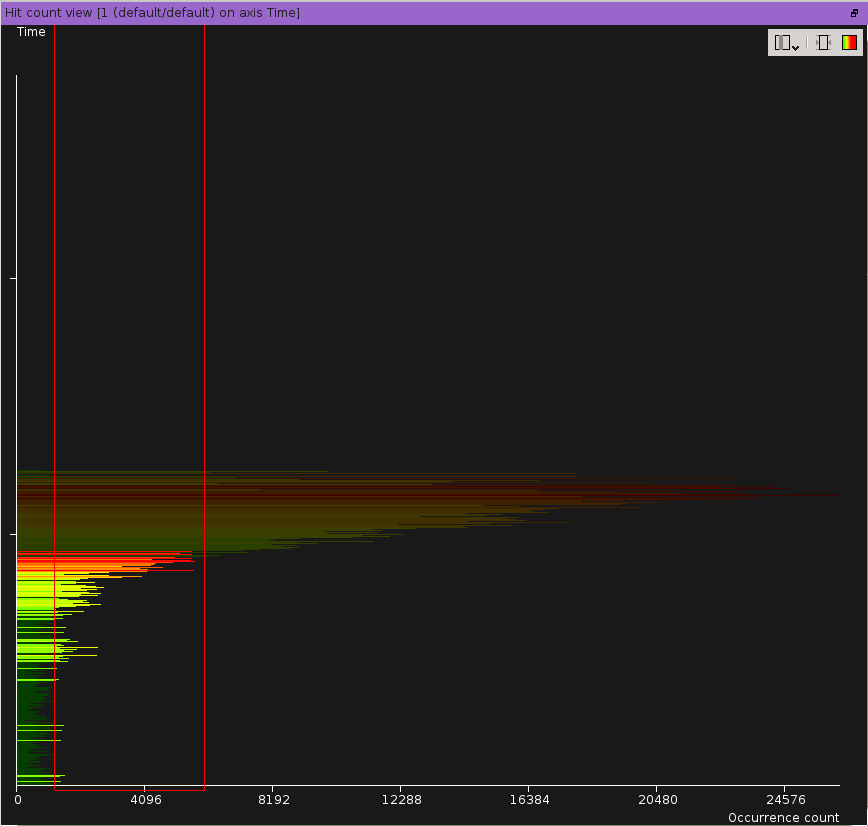
Sample of vertical selection
Zoom
There are three different zoom modes; depending on what the user wants to visualize.
The main zoom mode is only along the vertical axis and is performed by using the mouse’s wheel. It permits to easily identify areas where the high density denotes either a large number of events whom hit count is relatively low, or a high number of occurences for a low count of different events. In the first case, the more we zoom, the more the density pick will decrease. In the second case, wathever the zoom level, the density pick will still roughly be unchanged.
The second zoom mode is only along the horizontal axis and is performed by pressing the ‘shift’ key while using the mouse’s wheel. It simply permits to enhance the readability of the visible area.
The last zoom mode is simultaneous along the two axes and is performed by pressing the ‘control’ key while using the mouse’s wheel.
A fourth mode which can be assimilated to a zoom: to help searching for events, the visible area can be automatically rescaled, when zooming, to make hit counts optimally fit in the view. This functionality is disabled by default and can be (de)activated with the shortcut ‘f’.
Options
- Selection mode
To control the selection mode: ‘rectangle’, ‘horizontal’, or ‘vertical’.
- Color gradient mode
To control the color gradient used to draw hit counts: ‘linear’ or ‘logarithmic’.
- Automatic horizontal fit mode
To control if the view must horizontally rescale the hit count when zooming or not
Shortcuts
f to toggle horizontal automatic fit mode
l (ell) to toggle linear/logarithmic gradient modes
r to set selection mode to rectangle
h to set selection mode to horizontal
v to set selection mode to vertical
Accessing the view
There are three ways to access this graphic view.
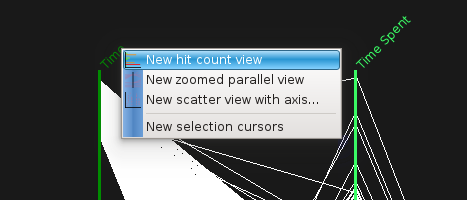
By right-clicking on the axis header on the parallel view:
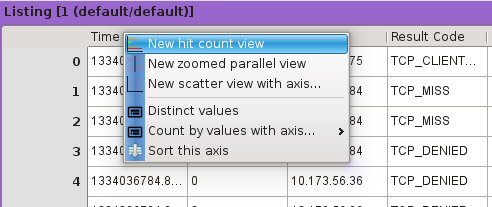
By right-clicking on the header of column in the listing view:
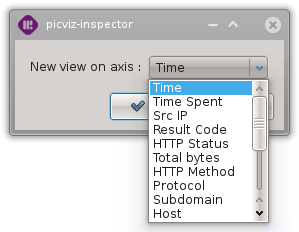
By clicking on the hit count view button located on the workspace toolbar and selection the appropriate axis: