Global Parallel Coordinates View
This is usually the main and central Graphical View of an investigation done with Squey.
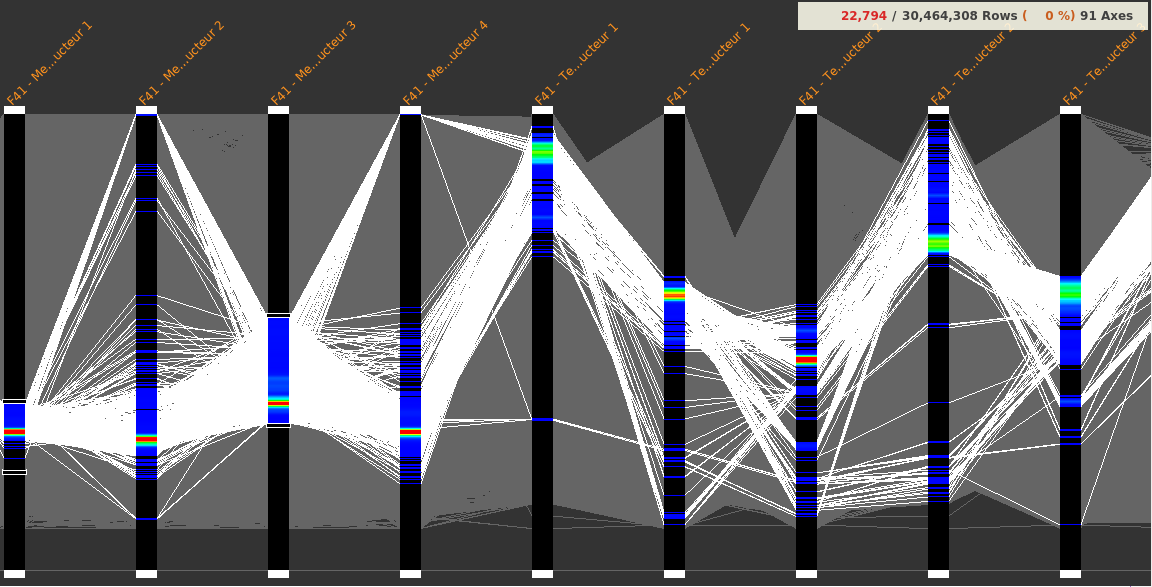
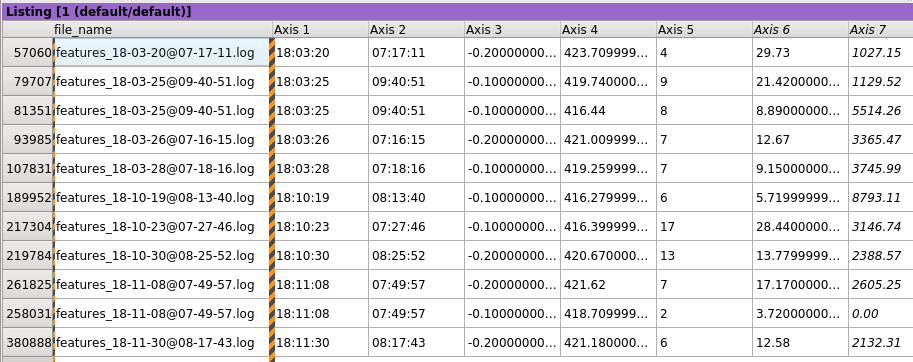
The Global Parallel Coordinates View looks like this:
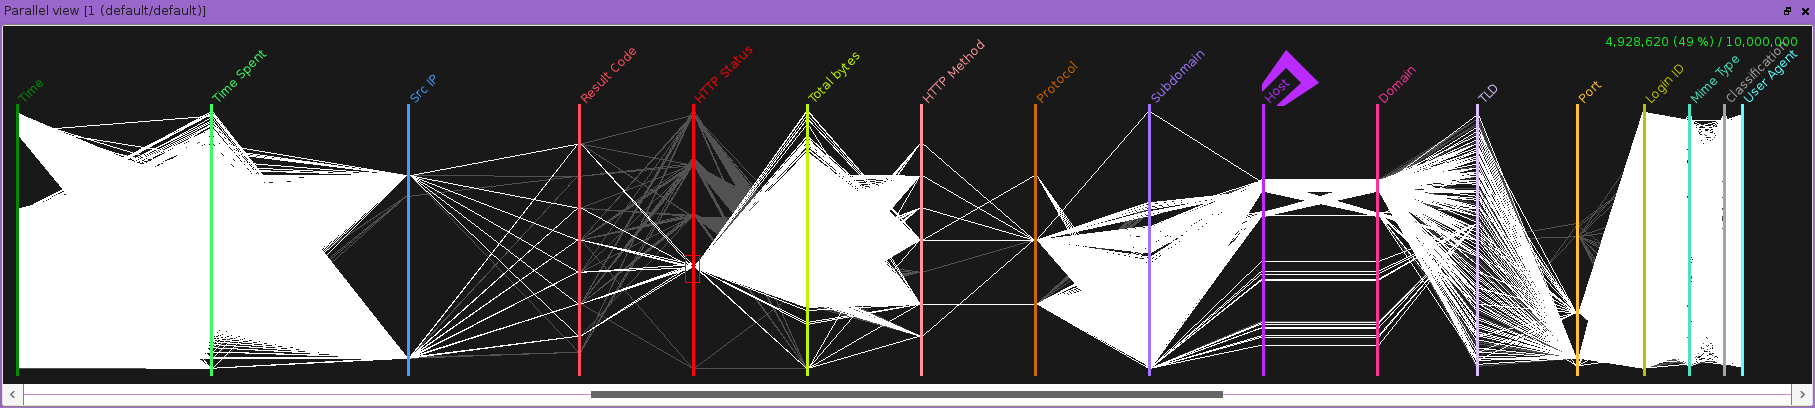
Interaction
The Global Parallel Coordinates View offers the following interaction possibilities:
‘Mouse Wheel’: Globally shrinks or expands the horizontal distances between Axes. This modification of the inter-axis distances is done far all the Axes.
‘Ctrl + Mouse Wheel’: Horizontally shrinks or expand the only inter-axis area that is under the mouse cursor during the mouse wheel movement. All other inter-axis distances remain the same. This is usefull when the user wants to emphasise one zone of the Global Parallel Coordinates View but keep the other Axes rather tightly packed or, on the contrary, when the user wants to reduce the visual importance of less interesting zones of the Global Parallel Coordinates View.
‘Mouse Right Button’: Horizontal displacement (translation) of the representation. This is the simplest way to do a horizontal panning of the Global Parallel Coordinates View. This has the same effect as a manipulation of the horizontal slider of the View, except that: * a finer control on the actual displacement is achieved by the Mouse Right Button. * a long distance translation is faster with the horizontal slider.
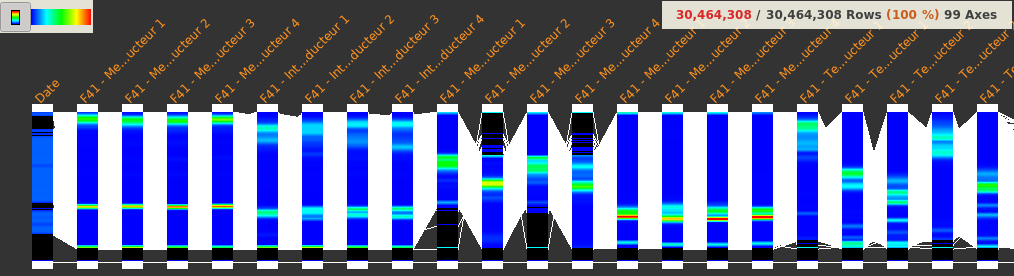
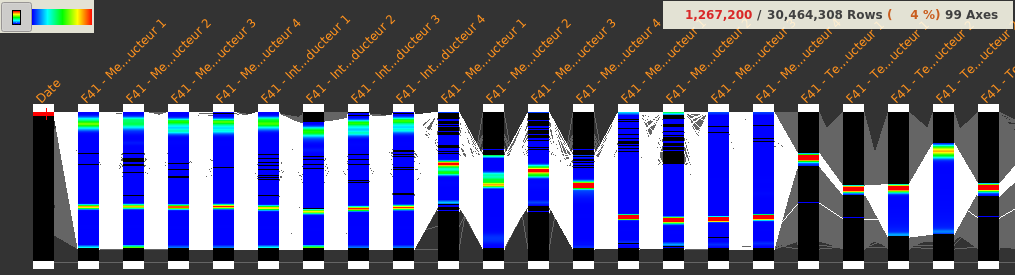
Density
A blue-to-red gradient in the axes can be enabled in order to give an indication of the number of lines going through each point of the axes.
The gradient is automatically updated whenever the selection has changed.
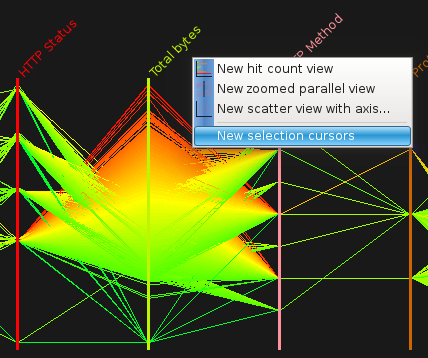
Context menu
A context menu is accessible from the Axis headers; it provides a quick access to views creation and selection cursors creation related to the clicked axis.

Selections
There are essentially two ways to make Selections with the Mouse on the Global Parallel Coordinates View.
Range selection
A fast way to select Events is to define range cursors on a given Axis.
range cursors creation
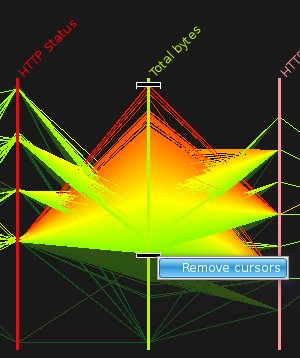
sample of range cursors
range cursors removal
You can add as many range cursors as you want to help narrowing the selection with more control.
Rectangular selection
The Rectangular Selection, albeit slightly slower than the range selection, could achieve to select isolated Events.
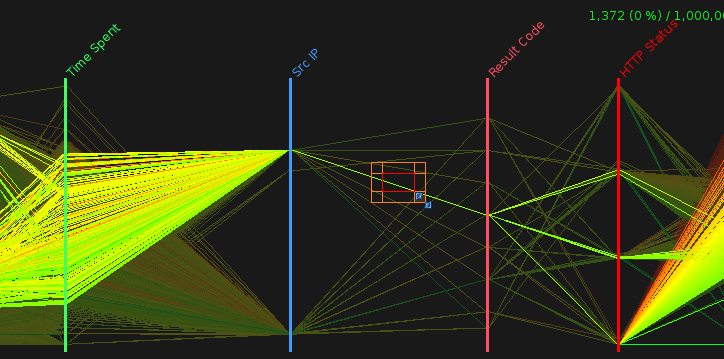
Rectangular Selection creation/removal can be done as follow:
Modifying the rectangular selection could be done as follow:
‘arrows’ keys: moves rectangle by one pixel;
‘control’ + ‘arrows’ keys : moves rectangle by a step of its size;
‘shift’ + ‘arrows’ keys: shrinks or grows the rectangle.
Boolean operations can also be achieved using:
‘shift’ + ‘mouse right button’: union with previous rectangular selection;
‘control’ + ‘mouse right button’: substraction of the previous rectangular selection;
‘control’ + ‘shift’ + ‘mouse right button’: intersection with previous rectangular selection.
Changing the representation of an axis
Changing the representation of an axis can be achieved using the Mapping and Scaling editors through the data tree widget.
Sample of mapping change
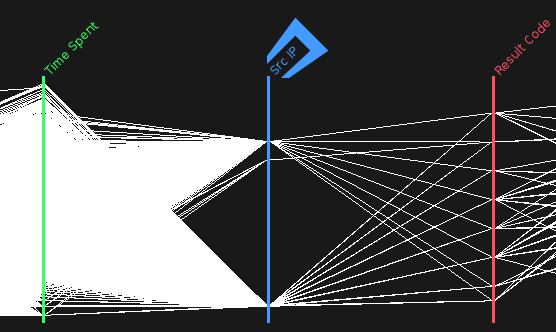
‘Src IP’ column using ‘ipv4’ mapping
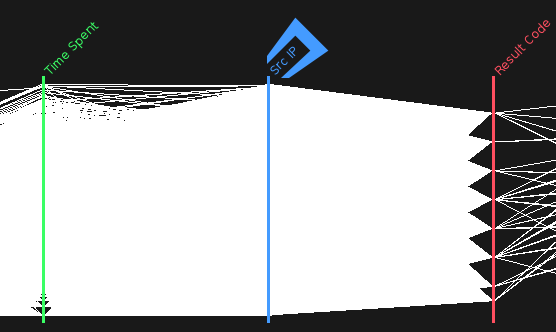
‘Src IP’ column using ‘enum’ mapping
Sample of scaling change
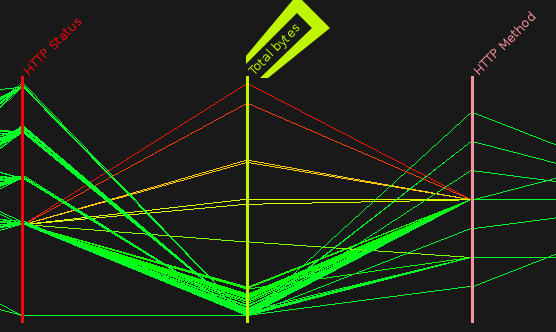
‘Total bytes’ column using ‘Min/max’ scaling
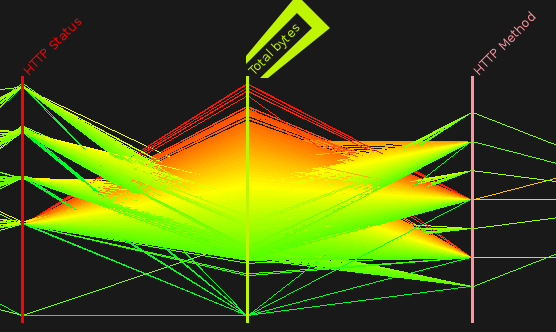
‘Total bytes’ column using ‘Logarithmic Min/max’ scaling
As we can see, using a logarithmic scale mitigates the fact that highest values are stretching the lowest ones. Therefore, this scale provides a wider repartition when values take up to several orders of magnitude.
Multi-inputs
When the Source contains multiple Inputs, an extra column containing the name of the input in automatically created.
Accessing the view