Views in Squey
Squey is a graphically oriented investigation software on multi-dimensional large sets of data. That’s why it uses different graphical representations.
By extension, all widgets that present any kind of data is called a View. This applies to the following forms of data representations:
in raw format (as given by the original strings in the text files, for example)
in a graphical representation
as the result of computations done on the raw data.
Warning
In the Squey terminology, these graphical and non-graphical representations are called Views.
The next screenshot gives a sample of the most significant Views in Squey:
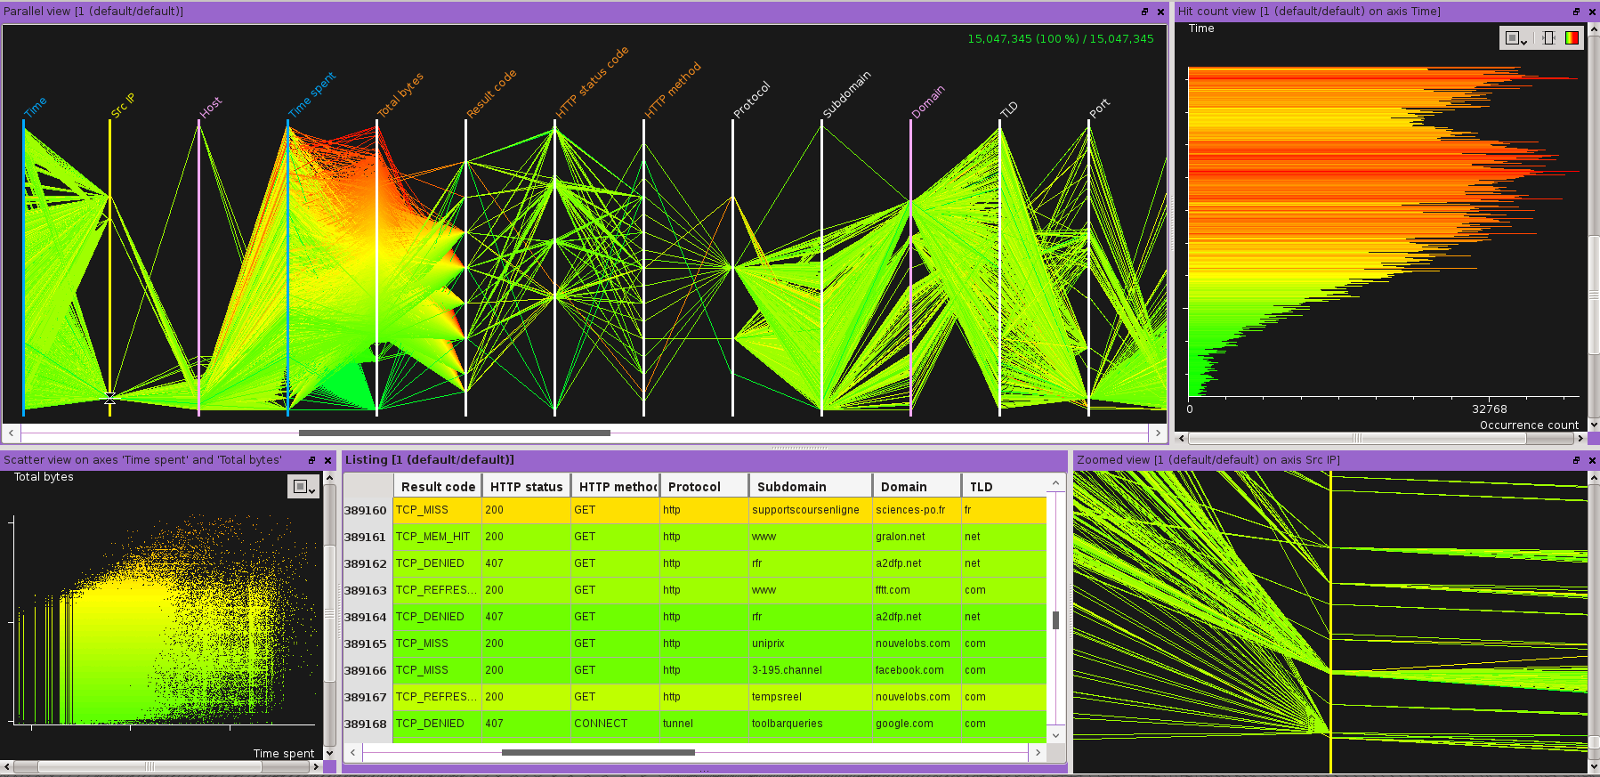
Graphical Views
Squey provides different Graphical Views to help the user interact with its data or get an idea of what this data express.
Non-Graphical Views
As said before, some of the Views in Squey are non-graphical.
Today, this terminology encompasses the following Views:
the Listing View
the Layer Stack View
the Statistics Views
List of all Views in Squey
As of the current version of Squey, the available Views are the following:
the Listing View
the Layer Stack View
the Series View
the Hit Count View
the Statistics Views:
the Count by dialog
the Sum by dialog
The aim of the next chapters is to present in detail all the Views that are available in Squey.