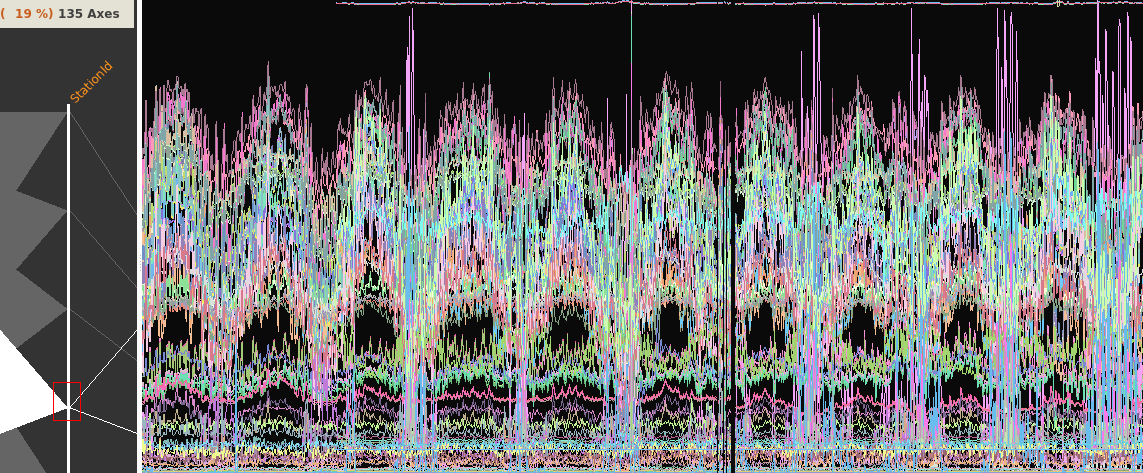
Series View
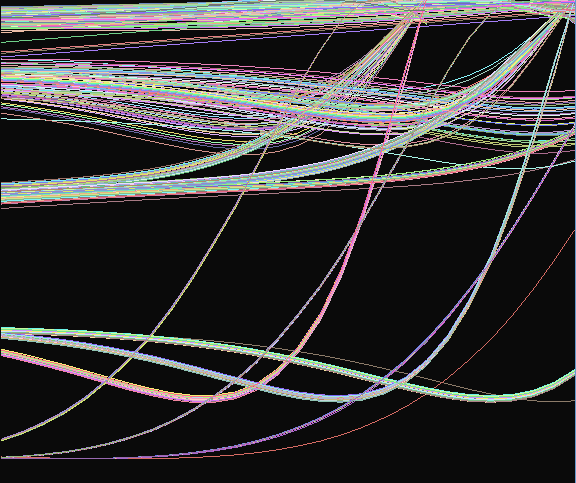
This visualization displays different sets of metrics evolving over a common dimension. Each numeric axis of the parallel coordinates view can therefor be displayed as a serie. Thereby, a serie is dependant of the Scaling of its axis.
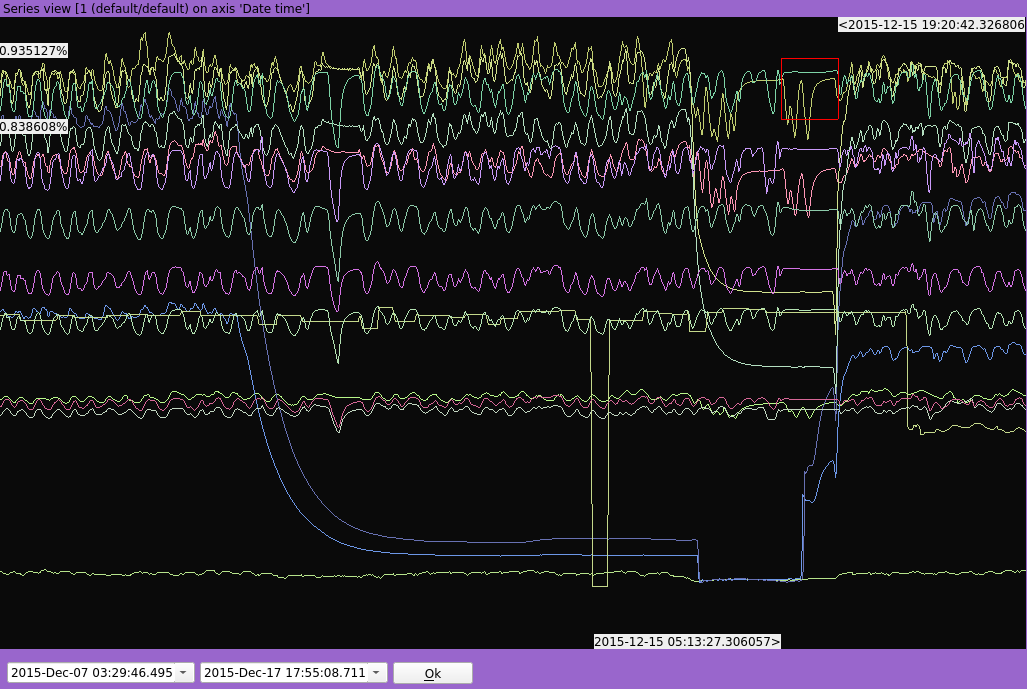
Zoom
Zoom level over the common dimension (X-axis) can be changed using the mouse wheel button or by doing a click-and-drag. An homothetic zoom can be done using the “Ctrl” modifier both with the mouse wheel button or with a click-and-drag.
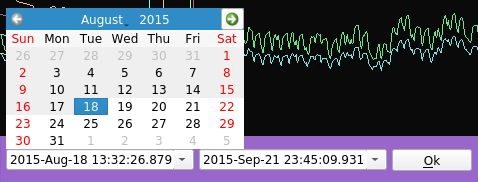
It is also possible to zoom between two values using the range widget :
Selection
Selecting a continuous range of values over the common dimension (X-axis) by doing a “Shift” + click-and-drag will instantly transfert the selection to the others views.
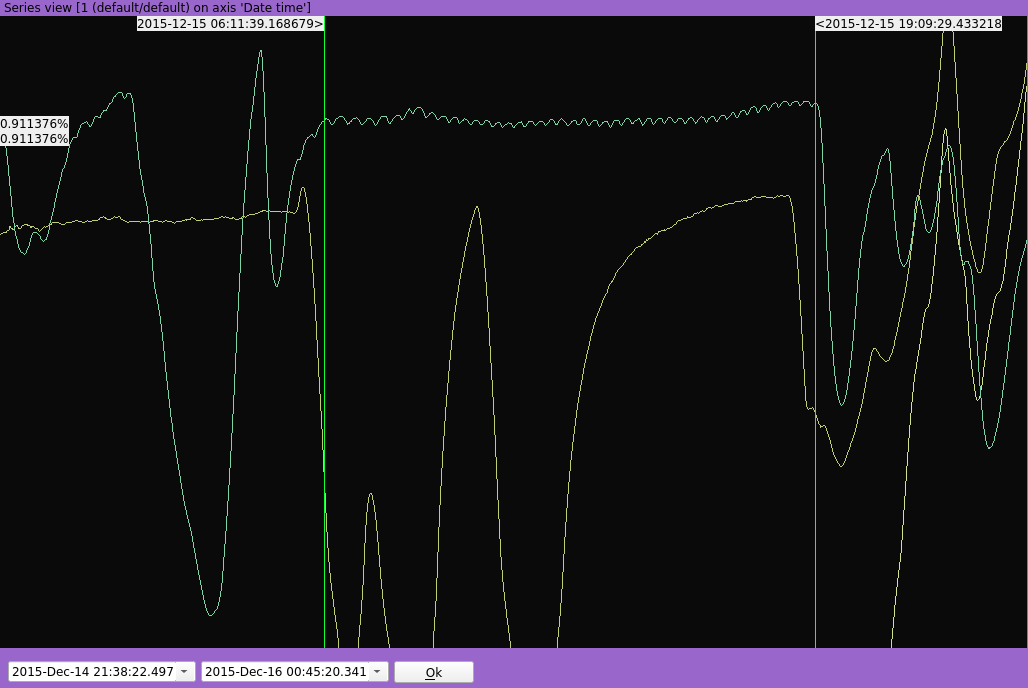
The current selection of the Source has also an impact over the display of the timeseries : only the selected values are taken into account an the view is refreshed instantly upon any selection change.
Rendering modes
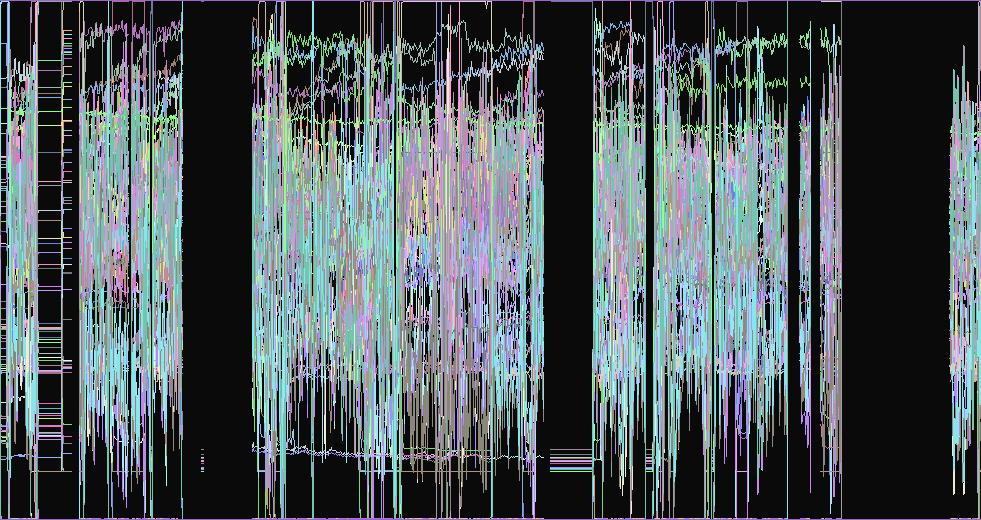
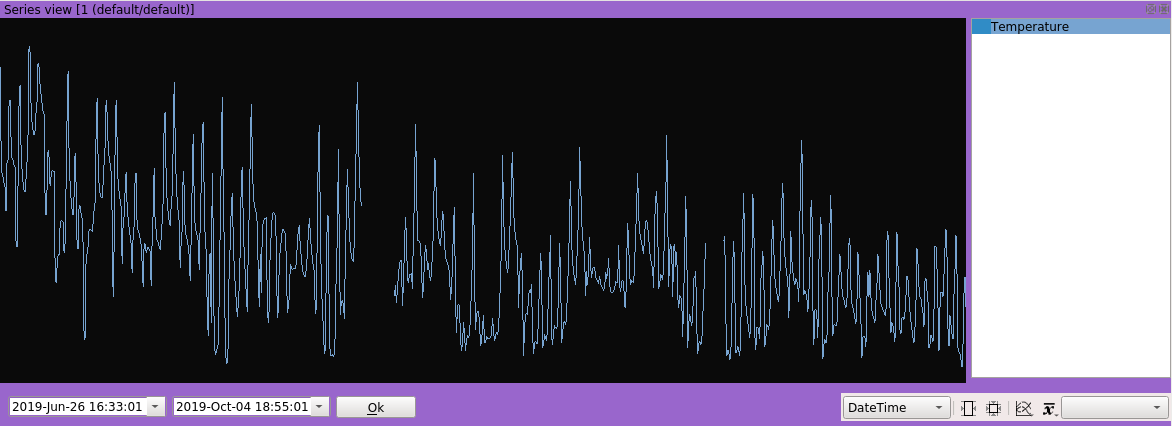
Lines
This is the default mode. It allows to easily spot gaps in data.
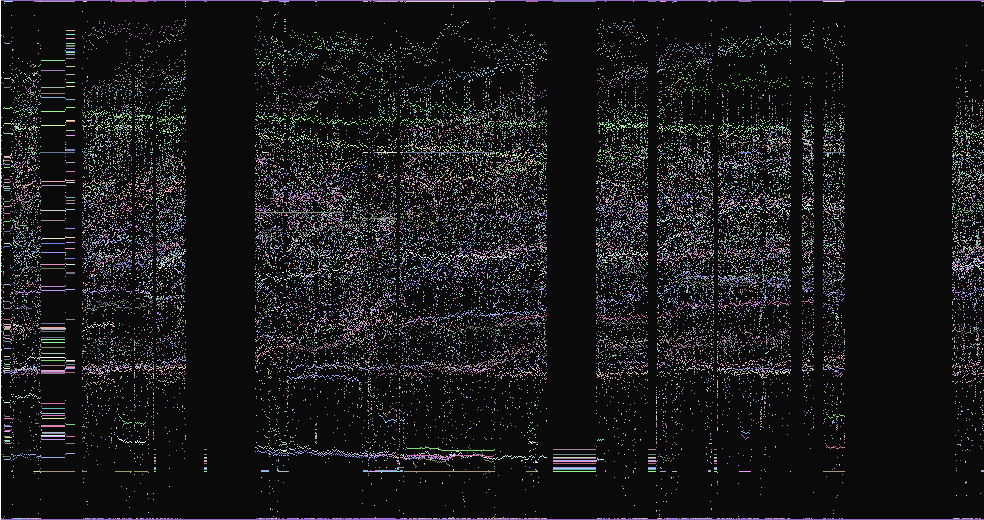
Points
This alternative mode can be interesting when the values are a bit chaotic.
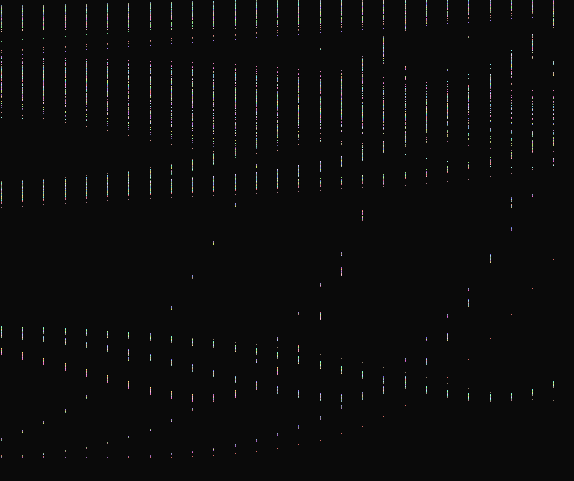
Lines Always
This mode is advisable when the values are widely spaced and an interpolation is needed.
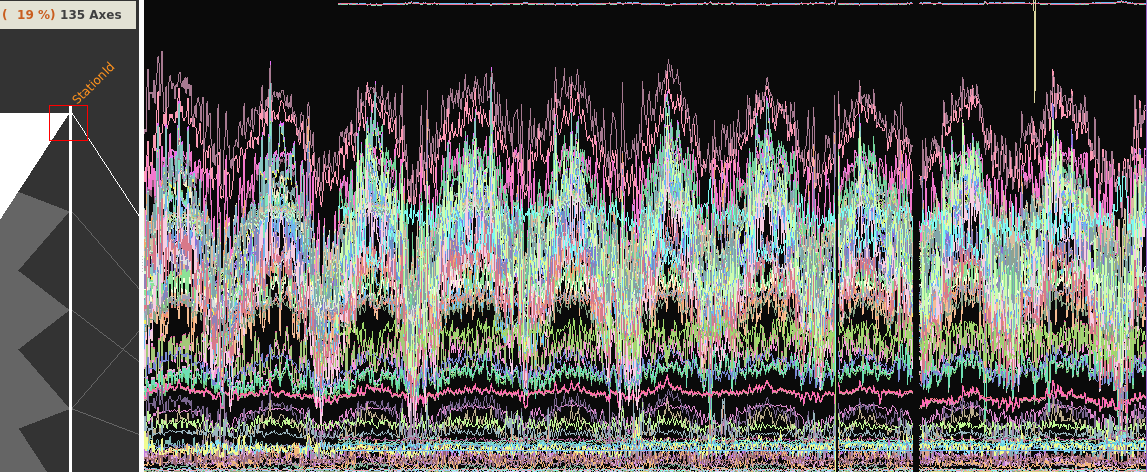
Splitting the series according to a specific axis
It can sometimes be convenient to split one or more series according to the values contained in a specific column in order to reveal information that was previously hidden.
The resulting series are then superposed allowing to easily spot abnormal behavior.
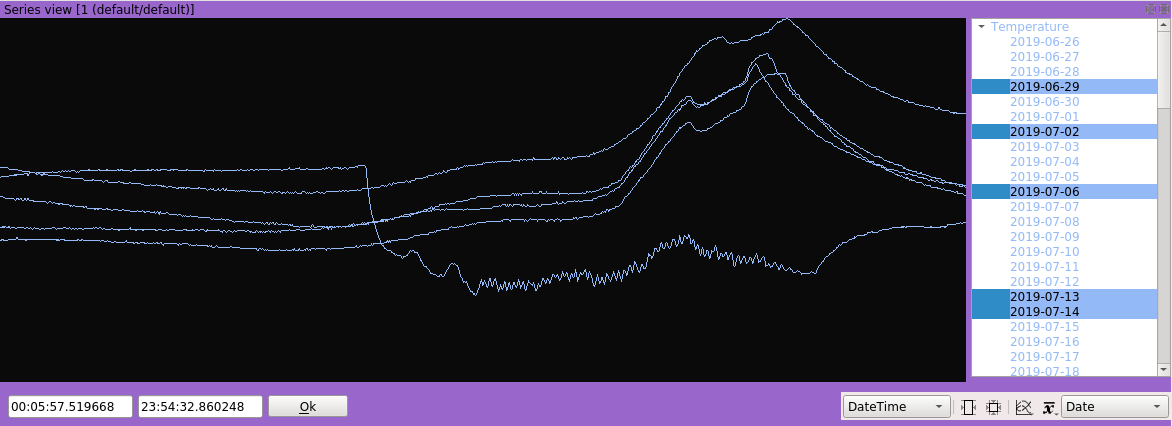
Any column can be used to split the series by selecting it in the proper combo box.
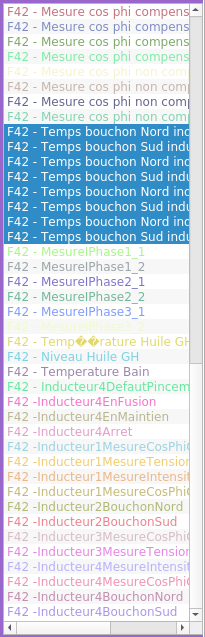
Selecting the series to display
A click-and-drag over the list of series can toggle activate or deactivate several series at a time.
Accessing the view
There are three ways to access this graphic view.
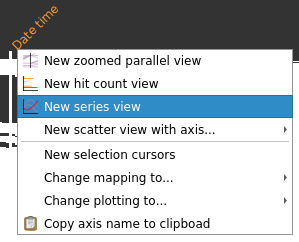
By right-clicking on the header of a zone on the parallel view:
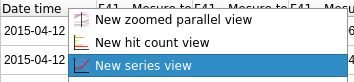
By right-clicking on the header of column in the listing view:
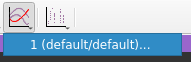
By clicking on the scatter view button located on the workspace toolbar and selection the appropriate zone:
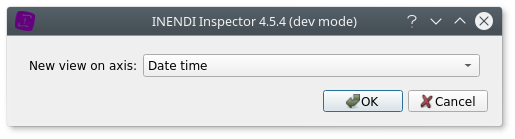
The selected axis will then be used a the common dimension (X-axis), and all the other numeric axes will be displayed a series (Y-axis).