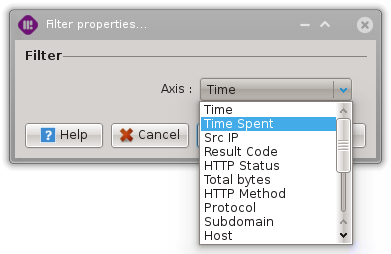
Axis Gradient Filter
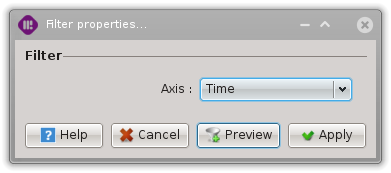
Dialog widget of the Axis Gradient Filter
The aim of this Filter is to colorize Events according to the value they carry on one of their dimension. The idea is very simple: suppose the third Axis carries the hour of the Event, from 00:00:00 (at the very bottom of the Axis) to 23:59:59 (at the very top of the Axis). If the third Axis is used to apply an Axis Gradient Filter, then a green-to-red color gradient will be used to map the hour to a particular color:
Events get a green color if they happen early during the day.
Events get a yellow color if they happen around noon.
Events get a red color if they happen by the end of the day.
Let’s have a look at a real example! We start by a selection of Events that have no color indication:
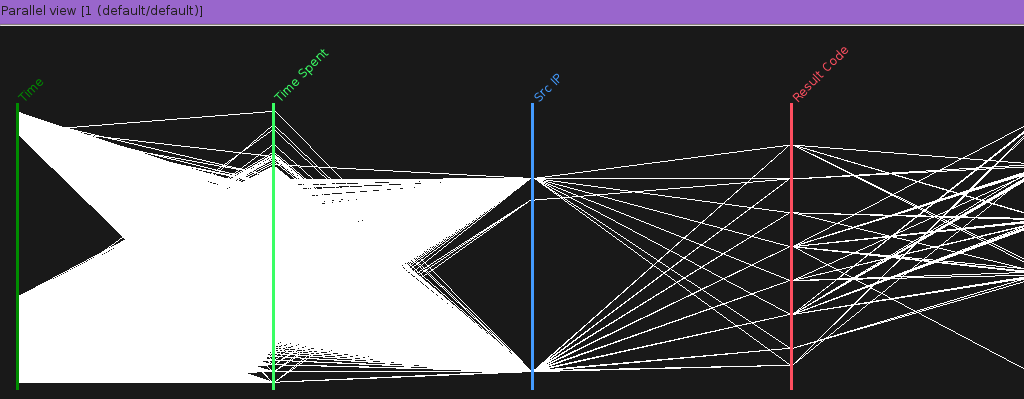
A parallel view using the default event color
We can apply an Axis Gradient Filter to the first Axis (the _Time_ Axis in our case):
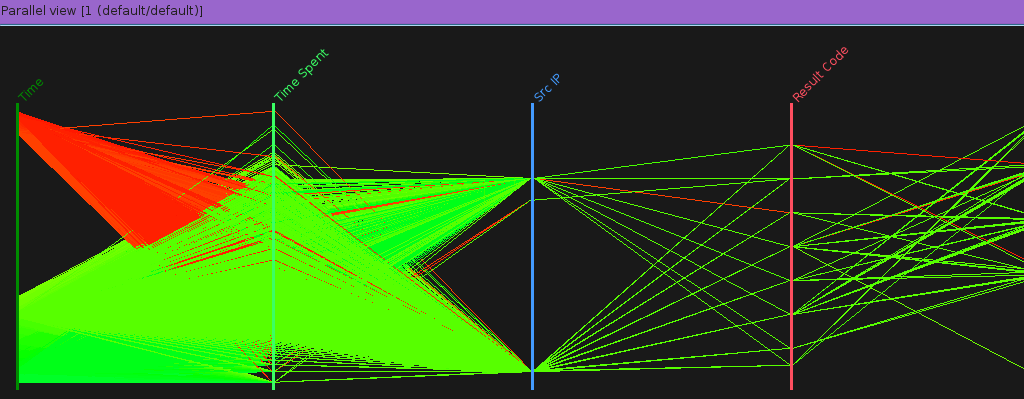
The same parallel after applying an Axis Gradient Filter on the ‘Time’ Axis
This Axis Gradient Filter is usefull if you want to correlate positions (i.e. values) of Events on a specific Axis (the third one in our example) with one Axis or possibly many other Axis. Without beeing very accurate, the color information given to the Events by the color gradient is a very easy way to get an intuitive feeling of possible links between the selected Axis and the other Axes.
Parameters
This filter’s dialog gives access to one parameter: the considered axis which is controlled using a combo-box.
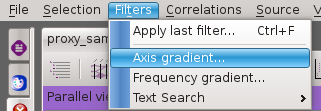
Access
There are two ways to access this filter.
By using the ‘Axis gradient…’ menu entry:
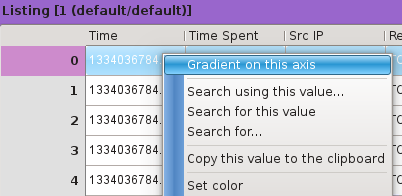
By right-clicking on a column in the listing view: